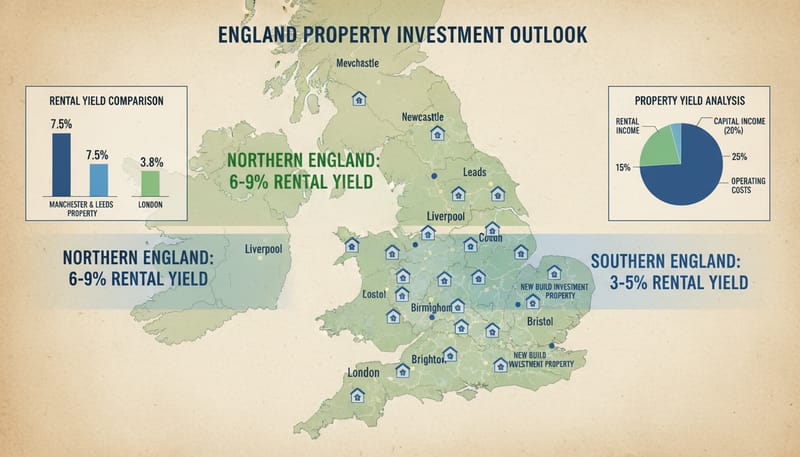
The perennial debate in UK property investment — Northern versus Southern England — has intensified in recent years as the traditional dynamics have shifted dramatically. For decades, the formula was straightforward: Southern England (and London in particular) offered lower yields but stronger capital growth, while the North provided higher rental returns but more modest price appreciation. In 2025, this picture has become considerably more nuanced. Northern cities like Manchester, Liverpool, Leeds, and Sheffield have delivered both strong yields and impressive capital growth over the past five years, while parts of Southern England have seen yields compress to levels that challenge investment viability after costs. According to data from the Office for National Statistics (ONS) and HM Land Registry, the average house price in the North West grew by 23% between 2020 and 2024, compared to 14% in London and 17% in the South East — a dramatic reversal of the historical pattern that has significant implications for investors choosing where to deploy capital in 2025-2026.
For new build investment specifically, the regional dynamics carry additional layers of complexity. New build premiums — the additional cost of buying a new property compared to an equivalent resale — vary significantly by region, as do the rental premiums that new builds command over older stock. Developer incentives, Help to Buy legacy effects, and the pipeline of new supply all influence the investment equation differently in Northern and Southern markets. This comprehensive analysis examines yields, capital growth, and total returns city by city across both regions, providing the data-driven insight you need to make informed location decisions for your next new build investment. For foundational guidance on new build investment strategy, see our new build buy-to-let guide for UK investors.
Understanding Yield: Gross, Net, and Total Return
Before diving into the regional comparison, it is essential to understand the different measures of return and what they tell you about an investment's performance. Many investors focus exclusively on gross yield, which can be misleading when comparing properties with different cost profiles.
Gross Yield
Annual rent divided by purchase price, expressed as a percentage. The simplest measure but ignores all costs.
Net Yield
Annual rent minus all operating costs (management, insurance, maintenance, voids, service charges), divided by total investment cost (including SDLT and legal fees).
Total Return
Net yield plus annual capital appreciation. The most comprehensive measure of investment performance, capturing both income and growth.
The distinction between gross and net yield is particularly important when comparing Northern and Southern markets. A property in Manchester achieving 6.5% gross yield and a property in London achieving 4.0% gross yield may have much more similar net yields once costs are factored in — London's higher service charges, higher insurance premiums, and higher management fees erode the gross figure significantly. However, the gap typically remains in the North's favour for income returns.
Northern England: City-by-City Analysis
Northern England has emerged as the heartland of UK property investment over the past decade, offering a combination of strong yields, improving infrastructure, growing populations, and increasingly vibrant economies. The key investment cities in the North each offer distinct characteristics and opportunities.
Manchester
Manchester is widely regarded as the UK's strongest property investment market outside London. The city has experienced extraordinary transformation, driven by major employers (BBC, ITV, Amazon, Booking.com, and a growing tech sector), world-class universities (University of Manchester, Manchester Metropolitan), and infrastructure investment including the expanding Metrolink tram network and the HS2 connection (now confirmed to Manchester Airport). The population of Greater Manchester grew by 7.2% between 2011 and 2021, and is projected to grow by a further 5% by 2031.
Manchester's investment hotspots include the city centre (Deansgate, Ancoats, New Islington), Salford Quays (MediaCityUK), and emerging areas like the Northern Quarter fringes and New Cross. The city centre has seen massive new build development, with schemes from developers including Renaker, Select Property Group, and Peel Group delivering thousands of high-specification apartments. While this supply pipeline has moderated rent growth in some micro-locations, the overall trajectory remains positive due to sustained demand from the city's growing professional workforce.
Liverpool
Liverpool consistently delivers some of the highest gross yields in the UK, reflecting its lower average property prices combined with a robust rental market. The city has benefited from significant regeneration investment, including the £5.5 billion Liverpool Waters development, the new Everton stadium at Bramley-Moore Dock, and ongoing investment in the Knowledge Quarter around the universities and the Royal Liverpool Hospital.
Liverpool's key investment areas include the Baltic Triangle (creative and tech hub), the city centre waterfront, and the L1 postcode area. The student market is particularly strong, with over 70,000 students across three universities. However, investors should be aware that Liverpool's lower price point has attracted significant off-plan development marketed to overseas investors, and some areas have seen oversupply of low-quality apartments. Quality, location, and developer reputation are critical differentiators in this market.
Leeds
Leeds has established itself as the financial and professional services capital of Northern England, with a diverse economy spanning financial services, legal, digital, health, and manufacturing. The city's economic base has broadened significantly, reducing its vulnerability to sector-specific downturns. Major employers include NHS Digital, HMRC (which relocated a major processing centre to Leeds), Channel 4 (national HQ), and a growing cluster of fintech companies.
Sheffield and Newcastle
Sheffield and Newcastle represent the second tier of Northern investment cities, offering some of the highest yields in England but with more modest capital growth prospects than Manchester or Leeds. Sheffield benefits from two major universities, a growing advanced manufacturing sector, and significant urban regeneration, while Newcastle has a vibrant city centre, a strong student market, and improving connectivity.
Sheffield
Newcastle
Southern England: City-by-City Analysis
Southern England remains the UK's most valuable property market, with higher average prices driven by proximity to London, stronger average incomes, and historically constrained supply. However, for investors seeking income returns, the higher price point means yields are typically lower — sometimes significantly so.
London
London is the UK's largest and most liquid property market, with over 3.5 million households and a private rented sector that houses approximately one in four residents. The city offers unparalleled economic diversity, international connectivity, and cultural capital. However, for yield-focused investors, London presents a challenge: the ratio of house prices to rents has stretched to levels that make achieving positive cash flow difficult, particularly for new builds in prime locations.
Within London, yields vary dramatically by borough. Outer London boroughs such as Barking and Dagenham, Croydon, Bexley, and Hounslow can achieve gross yields of 5-6%, while prime central areas such as Kensington, Chelsea, and Westminster may achieve only 2.5-3.5%. For new build investment, the most productive London locations are typically Zone 3-5 boroughs with good transport links, where prices are more affordable relative to rents. Developments near Elizabeth Line stations have seen particularly strong rental demand since the line opened.
Bristol
Bristol has emerged as one of the UK's most dynamic cities, with a thriving tech sector (sometimes called 'Silicon Gorge'), aerospace and defence industry (Airbus, Rolls-Royce), two strong universities, and a vibrant cultural scene. The city consistently ranks among the best places to live in the UK and has attracted significant inward migration from London, driving demand for both sales and rental properties.
Brighton and Cambridge
Brighton and Cambridge represent premium Southern markets with high demand, limited supply, and strong economic fundamentals. Brighton offers a lifestyle premium with strong London commuter demand, while Cambridge benefits from its world-renowned university and the booming science and technology corridor. Both cities have relatively constrained new build supply due to planning restrictions, which supports prices but limits investment opportunities.
Brighton
Cambridge
The Comprehensive Yield Comparison Table
The following table provides a side-by-side comparison of all key metrics across the major investment cities in both Northern and Southern England, based on new build two-bedroom apartment data for 2025:
| City | Avg Price | Monthly Rent | Gross Yield | Est. Net Yield | 5yr Capital Growth (avg/yr) | Est. Total Return |
|---|---|---|---|---|---|---|
| Manchester | £255k | £1,200 | 5.6% | 3.8-4.2% | 4.5-5.5% | 8.3-9.7% |
| Liverpool | £185k | £975 | 6.3% | 4.2-4.8% | 3.5-5.0% | 7.7-9.8% |
| Leeds | £225k | £1,050 | 5.6% | 3.6-4.2% | 4.0-5.5% | 7.6-9.7% |
| Sheffield | £180k | £925 | 6.2% | 4.0-4.6% | 3.5-4.5% | 7.5-9.1% |
| Newcastle | £175k | £900 | 6.2% | 3.9-4.5% | 3.0-4.5% | 6.9-9.0% |
| London (Zones 3-5) | £420k | £1,700 | 4.9% | 2.8-3.4% | 2.5-4.0% | 5.3-7.4% |
| London (Prime Central) | £750k+ | £2,500+ | 3.0-3.5% | 1.5-2.2% | 2.0-3.5% | 3.5-5.7% |
| Bristol | £330k | £1,275 | 4.6% | 2.9-3.5% | 3.5-5.0% | 6.4-8.5% |
| Brighton | £360k | £1,350 | 4.5% | 2.8-3.3% | 3.0-4.5% | 5.8-7.8% |
| Cambridge | £415k | £1,425 | 4.1% | 2.5-3.0% | 3.5-5.0% | 6.0-8.0% |
Capital Growth vs Income: The Strategic Trade-Off
The fundamental strategic question for property investors is whether to prioritise rental income (yield) or capital appreciation (growth). Northern cities generally favour income, while Southern cities favour growth, though the gap has narrowed considerably in recent years.
When to Prioritise Yield (Favour Northern Markets)
- You need positive monthly cash flow to cover mortgage payments and expenses
- You are building a portfolio and need each property to contribute to running costs
- You are investing through a limited company where rental profit is taxed at 25% corporation tax (lower than the 40-45% income tax that high-earning individuals pay)
- You are approaching or in retirement and need income from your portfolio
- You are using higher leverage (larger mortgages) where cash flow is critical to sustainability
When to Prioritise Growth (Favour Southern Markets)
- You have alternative income sources and do not depend on rental cash flow
- You are investing for long-term wealth building over 10-20+ years
- You are a higher-rate taxpayer where rental income is heavily taxed but capital gains tax is capped at 24%
- You want maximum capital appreciation to leverage into further purchases
- You are investing with cash (no mortgage) where cash flow is less critical
The most sophisticated investors recognise that a balanced portfolio may include properties in both regions, combining the income reliability of Northern investments with the growth potential of selected Southern markets. For a portfolio of five to ten properties, having two or three in high-yielding Northern cities for cash flow and the remainder in growth-oriented Southern locations can provide both immediate income and long-term wealth creation.
SDLT Impact: How Tax Affects Regional Returns
Stamp Duty Land Tax (SDLT) significantly affects the true cost of acquisition and therefore the real yield on your investment. With the additional property surcharge of 5% (increased from 3% in October 2024) applying to all buy-to-let purchases, the SDLT burden is substantial — and it impacts Southern investments more heavily due to higher purchase prices.
| Purchase Price | SDLT (incl. 5% surcharge) | SDLT as % of Price | Typical City |
|---|---|---|---|
| £175,000 | £8,750 | 5.0% | Newcastle, Sheffield |
| £250,000 | £12,500 | 5.0% | Manchester, Leeds |
| £350,000 | £22,500 | 6.4% | Bristol, Brighton |
| £500,000 | £40,000 | 8.0% | London (Outer) |
| £750,000 | £67,500 | 9.0% | London (Prime) |
The differential is striking. An investor purchasing a £175,000 new build in Newcastle pays approximately £8,750 in SDLT, whereas one purchasing a £500,000 new build in London pays £40,000 — nearly five times more in absolute terms and 60% more as a proportion of the purchase price. This upfront cost must be recovered through rental income and capital growth, meaning the higher SDLT on Southern properties creates a higher hurdle rate for achieving acceptable returns. For detailed tax planning strategies, see our guide on tax strategies for new build property investors.
Infrastructure and Regeneration: Catalysts for Growth
Major infrastructure projects and regeneration programmes are key drivers of property value growth, and understanding the pipeline of investment in different cities can help identify where future outperformance is most likely. Both Northern and Southern cities have significant projects either underway or planned, though the scale and transformative potential varies.
Northern Powerhouse Projects
Manchester: HS2 + Northern Powerhouse Rail
HS2 to Manchester confirmed. Manchester-Leeds connectivity improvements. Estimated to add 3-5% to residential values within 1km of stations.
Liverpool: Everton Stadium + Liverpool Waters
New 52,888-seat stadium at Bramley-Moore Dock. £5.5bn Liverpool Waters regeneration. Estimated 10-15% boost to north docklands values.
Leeds: South Bank + HS2 Eastern Leg (TBC)
Europe's largest city centre regeneration. 35,000 new homes, 8,000 jobs. Transformative potential for city centre values.
Southern Growth Projects
London: Elizabeth Line Uplift (Ongoing)
Areas around Elizabeth Line stations continue to see above-average growth. Woolwich, Abbey Wood, and Forest Gate showing 5-8% outperformance.
Bristol: Temple Quarter Regeneration
£1.6bn mixed-use regeneration around Temple Meads station. University campus expansion. Major boost to city centre east values.
Cambridge: Life Sciences Expansion
Cambridge Biomedical Campus expansion. New laboratory and R&D facilities driving employment growth and housing demand in surrounding areas.
Cash Flow Comparison: The Monthly Reality
While yields and total returns provide the strategic picture, the monthly cash flow is what determines the day-to-day viability of your investment. Using a standardised 75% loan-to-value buy-to-let mortgage at 5.0% interest rate (representative of 2025 BTL rates), here is how monthly cash flow compares across key cities:
Monthly Cash Flow Comparison (75% LTV, 5.0% Interest-Only BTL)
| City | Price | Mortgage | Rent | Costs | Net Cash Flow |
|---|---|---|---|---|---|
| Manchester | £255k | -£797 | +£1,200 | -£250 | +£153 |
| Liverpool | £185k | -£578 | +£975 | -£200 | +£197 |
| Leeds | £225k | -£703 | +£1,050 | -£220 | +£127 |
| London (Z3-5) | £420k | -£1,313 | +£1,700 | -£380 | +£7 |
| Bristol | £330k | -£1,031 | +£1,275 | -£300 | -£56 |
| Brighton | £360k | -£1,125 | +£1,350 | -£310 | -£85 |
Costs include estimated management fees (10%), insurance, maintenance, and service charges. Does not include void periods or tax.
The cash flow analysis tells a clear story: Northern cities consistently deliver positive monthly cash flow, while Southern cities either break even or require the investor to subsidise the mortgage from other income. This does not make Southern investments inherently poor — the capital growth component provides returns that cash flow analysis alone does not capture. But it does mean that Northern investments are more self-sustaining and less vulnerable to interest rate increases or void periods.
Risk Factors by Region
Both regions carry distinct risk profiles that investors should understand and factor into their decisions:
Northern England Risks
- Oversupply in certain micro-locations: Some areas (parts of Liverpool, Salford) have seen significant apartment development that has outpaced demand in the short term
- Economic concentration: Some Northern cities are more dependent on specific sectors (Liverpool on public sector, Sheffield on manufacturing)
- Lower liquidity: Fewer buyer types (more investor-focused, fewer international buyers) can mean slower sales and wider bid-ask spreads
- New build premium erosion: In lower-price markets, the new build premium takes longer to absorb through general growth
Southern England Risks
- Interest rate sensitivity: Higher loan values mean more exposure to rate changes. A 1% rate rise costs £208/month more on a £250k mortgage vs £104/month on a £125k one
- Affordability ceiling: Already-stretched affordability limits rent growth potential — tenants simply cannot pay more
- Negative cash flow risk: Many Southern BTL investments are cash-flow negative, requiring ongoing subsidy from the investor
- Regulatory cost burden: Higher property values mean higher SDLT, higher insurance costs, and higher management fees in absolute terms
Frequently Asked Questions
Is it better to buy two Northern properties or one Southern property for the same budget?
For a budget of approximately £350,000-£400,000, you could purchase two properties in Liverpool or Sheffield, or one property in Bristol or outer London. Two Northern properties diversify your risk across two tenancies, provide higher combined cash flow, and reduce void period impact (if one property is empty, the other still generates income). A single Southern property concentrates risk but may deliver stronger capital growth. For most investors, particularly those building a portfolio, the Northern two-property option tends to provide better risk-adjusted returns in the current market.
Can Northern cities sustain current growth rates?
The strong growth in Northern cities over the past five years has been driven by fundamental factors — economic diversification, infrastructure investment, population growth, and relative affordability — rather than speculative excess. While growth rates may moderate, the structural drivers remain intact. The levelling up agenda, continued investment in Northern infrastructure, and the affordability advantage over the South suggest that Northern cities will continue to outperform on a risk-adjusted basis, though annual growth rates of 3-4% are more sustainable than the 5%+ seen in some recent years.
Should I invest near my home or in the best-performing market?
Investing near your home has practical advantages — easier property viewings, local market knowledge, and the ability to deal with emergencies quickly. However, these advantages are largely eliminated if you use a letting agent (which most BTL investors should). The data clearly shows that choosing the right market based on yields and growth potential is more important than geographical convenience. Many successful investors in the South own portfolios in the North, managed entirely through letting agents. Do not let proximity bias cost you tens of thousands in returns over the life of the investment.
How do energy efficiency regulations affect regional returns?
New builds in all regions benefit equally from being built to current energy standards, achieving EPC ratings of A or B. However, the competitive advantage over older stock is arguably greater in the North, where the existing housing stock tends to be older and less energy-efficient. A new build in Liverpool with EPC A stands out more against the local average than a new build in London where the existing stock is generally better maintained. This amplifies the 'green premium' in Northern markets. For detailed analysis, see our guide on new build eco-homes as future-proof investments.
Conclusion: Where Should You Invest in 2025-2026?
The data presents a compelling case for Northern England as the stronger choice for most new build investment strategies in 2025-2026. The combination of higher yields, improving capital growth, positive monthly cash flow, lower entry costs, and lower transaction taxes creates a more favourable investment environment for the majority of buy-to-let investors. Manchester, Liverpool, and Leeds consistently emerge as the standout cities, offering the best combination of income returns, growth potential, and economic fundamentals.
However, this does not mean Southern England should be dismissed. For investors with larger budgets who can absorb negative cash flow, selected Southern locations — particularly outer London boroughs with good transport links, Bristol, and Cambridge — offer the potential for superior long-term capital growth that can outweigh the income disadvantage over a 10-20 year holding period. The key is to match your investment strategy to your personal circumstances, financial capacity, and long-term objectives.
For most investors entering the market or expanding an existing portfolio, our recommendation is clear: focus your new build investment in Northern England's top-tier cities, where the fundamentals support both strong income returns and meaningful capital appreciation. Use the detailed city-by-city data in this guide to narrow your focus to specific locations and developments that match your target yield and growth profile. And always remember that within any city, the specific development, street, and unit type matter enormously — broad regional trends are the starting point, not the endpoint, of your investment analysis. For guidance on planning your eventual exit when the time comes, see our detailed guide on exit strategies for new build investment properties.